Naivasha Sanitation Analytics Dashboard
Naivasha Sanitation Analytics Dashboard
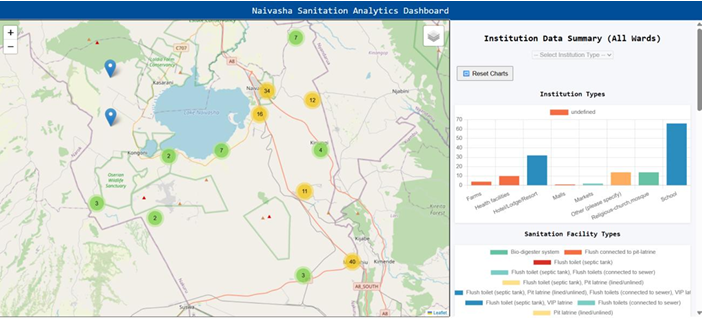
The Naivasha Sanitation Analytics Dashboard is a GIS-enabled decision-support system developed to support evidence-based sanitation planning, monitoring, and service delivery management. The platform integrates geospatial analytics, interactive dashboards, and field-collected datasets to provide stakeholders with real-time visibility into sanitation infrastructure, hygiene facilities, and waste management systems across Naivasha Sub-County.
Built using Python-based geospatial technologies, the platform enables planners and decision-makers to identify service gaps, assess infrastructure distribution, monitor institutional sanitation indicators, and prioritize investments using spatial evidence.
Key capabilities include:
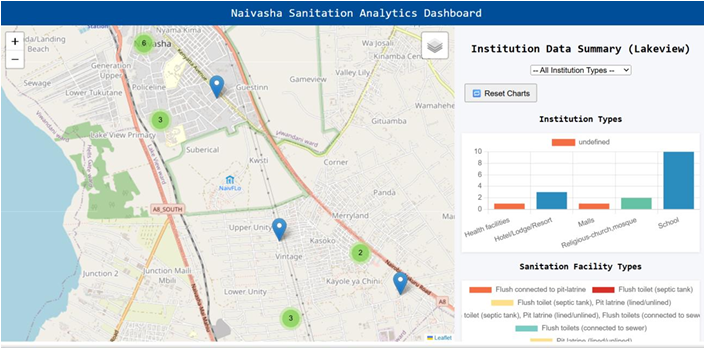
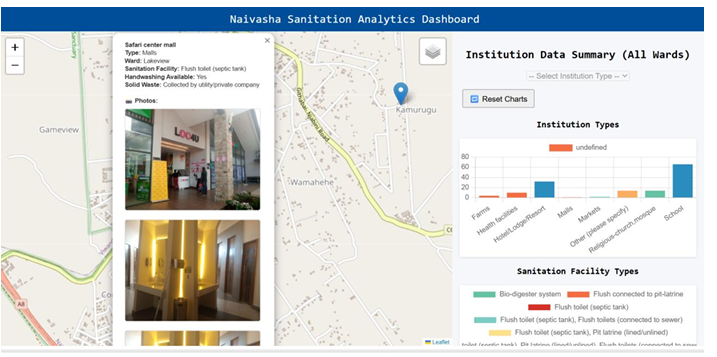
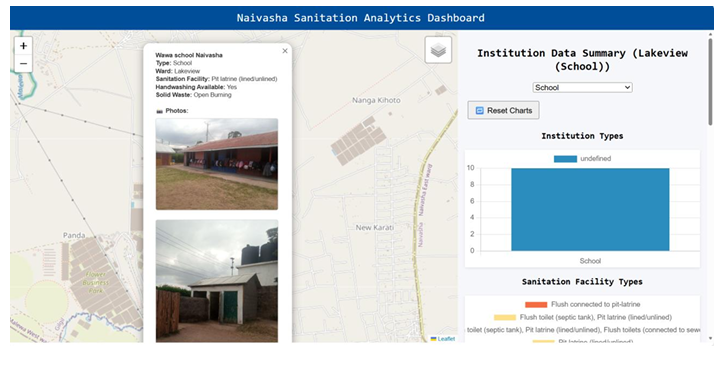
- Interactive geospatial visualization of sanitation facilities
- Ward-level and institution-level sanitation analytics
- Geo-tagged field data management
- Interactive charts and performance indicators
- Spatial monitoring of hygiene and waste management services
- Exportable reports and analytical summaries
The system demonstrates how geospatial intelligence can support public health planning, service delivery optimization, and sustainable urban sanitation management.
Ready to Start Your Project?
Let's discuss how we can apply our geospatial intelligence expertise to your environmental monitoring and climate resilience challenges.